Clase 2: About Python
¿Qué es Python?
Python es un lenguaje de propósito general creado en 1989 por Guido van Rossum.
La primera versión Python 0.9.0. fue lanzada en 1991, la versión Python 2.0 en el 2000. La versión 3.0 fue publicada en el 2008.
Python es gratuito y de código abierto. El desarrollo se encuentra coordinado por Python Software Fundation
Actualmente es uno de los lenguajes más populares.
¿Por qué es tan popular?
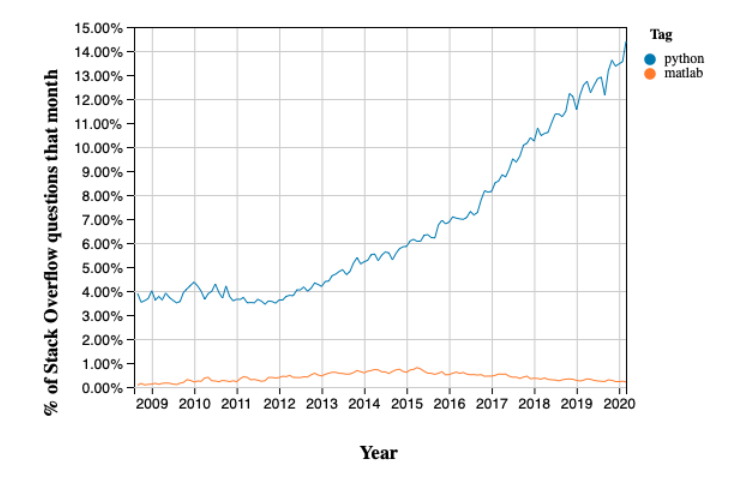
La popularidad de Python con respecto a otros lenguajes, por ejemplo a Matlab, ha incrementado sostenidamente.
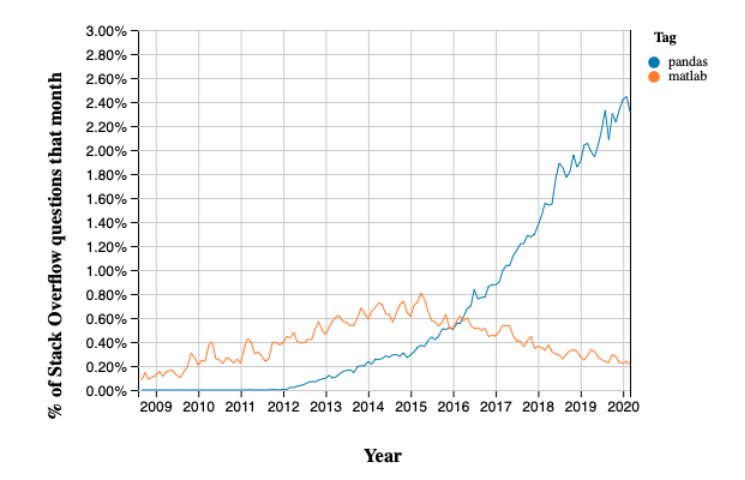
La popularidad de Python viene de la mano con la popularidad de librerías como pandas
Es fácil de ocupar.
Es gratuito.
Gran comunidad, ejm: stackoverflow.
Grandes desarrolladores utilizan python: Google, Facebook, Amazon.
Gran número de librerías: para análisis de datos, inteligencia artificial, gráficos, métodos numéricos, etc.
Eficiente, rápido, limpio, flexible.
Se puede integrar con otros lenguajes como R o Julia.
Algunos ejemplos
Manejo de bases
import numpy as np
import pandas as pd
df = pd.read_csv("/home/felix/Dropbox/ayudantia1.csv", sep="\t")
df2= df.rename(columns = {'Tasa de desempleo': 'desempleo', 'PIB a precios corrientes': 'PIB' }, inplace = False)
df2[20:30]
| Periodo | desempleo | PIB | |
|---|---|---|---|
| 20 | 01/03/15 | 6.23 | 39179.71 |
| 21 | 01/06/15 | 6.67 | 39535.45 |
| 22 | 01/09/15 | 6.54 | 38263.48 |
| 23 | 01/12/15 | 5.87 | 42574.71 |
| 24 | 01/03/16 | 6.49 | 41953.61 |
| 25 | 01/06/16 | 7.02 | 41447.91 |
| 26 | 01/09/16 | 7.03 | 40805.27 |
| 27 | 01/12/16 | 6.20 | 45330.60 |
| 28 | 01/03/17 | 7.04 | 43602.20 |
| 29 | 01/06/17 | 7.31 | 44040.88 |
Gráficos
import numpy as np
import matplotlib.pyplot as plt

np.random.seed(19680801)

mu_x = 200
sigma_x = 25
x = np.random.normal(mu_x, sigma_x, size=100)

mu_w = 200
sigma_w = 10
w = np.random.normal(mu_w, sigma_w, size=100)

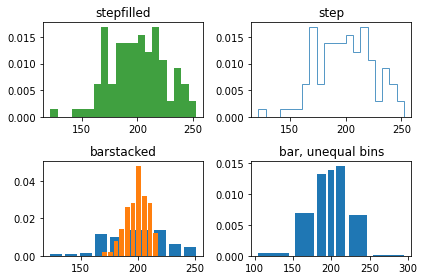
fig, axs = plt.subplots(nrows=2, ncols=2)

axs[0, 0].hist(x, 20, density=True, histtype='stepfilled', facecolor='g',
               alpha=0.75)
axs[0, 0].set_title('stepfilled')

axs[0, 1].hist(x, 20, density=True, histtype='step', facecolor='g',
               alpha=0.75)
axs[0, 1].set_title('step')

axs[1, 0].hist(x, density=True, histtype='barstacked', rwidth=0.8)
axs[1, 0].hist(w, density=True, histtype='barstacked', rwidth=0.8)
axs[1, 0].set_title('barstacked')

# Create a histogram by providing the bin edges (unequally spaced).
bins = [100, 150, 180, 195, 205, 220, 250, 300]
axs[1, 1].hist(x, bins, density=True, histtype='bar', rwidth=0.8)
axs[1, 1].set_title('bar, unequal bins')

fig.tight_layout()
plt.show()
np.random.seed(19680801)
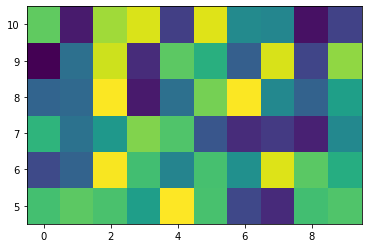
Z = np.random.rand(6, 10)
x = np.arange(-0.5, 10, 1)  # len = 11
y = np.arange(4.5, 11, 1)  # len = 7

fig, ax = plt.subplots()
ax.pcolormesh(x, y, Z)
<matplotlib.collections.QuadMesh at 0x7f0a2b6d0190>
import matplotlib.pyplot as plt
from matplotlib import cm
from matplotlib.ticker import LinearLocator
import numpy as np

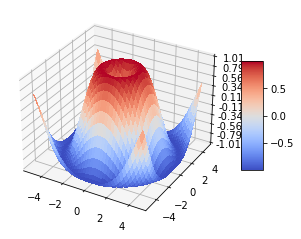
fig, ax = plt.subplots(subplot_kw={"projection": "3d"})

# Make data.
X = np.arange(-5, 5, 0.25)
Y = np.arange(-5, 5, 0.25)
X, Y = np.meshgrid(X, Y)
R = np.sqrt(X**2 + Y**2)
Z = np.sin(R)

# Plot the surface.
surf = ax.plot_surface(X, Y, Z, cmap=cm.coolwarm,
                       linewidth=0, antialiased=False)

# Customize the z axis.
ax.set_zlim(-1.01, 1.01)
ax.zaxis.set_major_locator(LinearLocator(10))
# A StrMethodFormatter is used automatically
ax.zaxis.set_major_formatter('{x:.02f}')

# Add a color bar which maps values to colors.
fig.colorbar(surf, shrink=0.5, aspect=5)

plt.show()
Regresiones
import numpy as np
import pandas as pd
import matplotlib.pyplot as plt

import statsmodels.api as sm
from statsmodels.sandbox.regression.predstd import wls_prediction_std

np.random.seed(9876789)

nsample = 100
x = np.linspace(0, 10, 100)
X = np.column_stack((x, x**2))
beta = np.array([1, 0.1, 10])
e = np.random.normal(size=nsample)


X = sm.add_constant(X)
y = np.dot(X, beta) + e

model = sm.OLS(y, X)
results = model.fit()
print(results.summary())


nsample = 50
sig = 0.5
x = np.linspace(0, 20, nsample)
X = np.column_stack((x, np.sin(x), (x-5)**2, np.ones(nsample)))
beta = [0.5, 0.5, -0.02, 5.]

y_true = np.dot(X, beta)
y = y_true + sig * np.random.normal(size=nsample)
res = sm.OLS(y, X).fit()

prstd, iv_l, iv_u = wls_prediction_std(res)

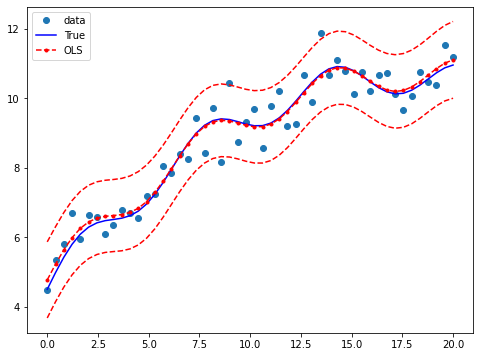
fig, ax = plt.subplots(figsize=(8,6))

ax.plot(x, y, 'o', label="data")
ax.plot(x, y_true, 'b-', label="True")
ax.plot(x, res.fittedvalues, 'r--.', label="OLS")
ax.plot(x, iv_u, 'r--')
ax.plot(x, iv_l, 'r--')
ax.legend(loc='best');
                            OLS Regression Results
==============================================================================
Dep. Variable:                      y   R-squared:                       1.000
Model:                            OLS   Adj. R-squared:                  1.000
Method:                 Least Squares   F-statistic:                 4.020e+06
Date:                Mon, 04 Apr 2022   Prob (F-statistic):          2.83e-239
Time:                        20:46:32   Log-Likelihood:                -146.51
No. Observations:                 100   AIC:                             299.0
Df Residuals:                      97   BIC:                             306.8
Df Model:                           2
Covariance Type:            nonrobust
==============================================================================
                 coef    std err          t      P>|t|      [0.025      0.975]
------------------------------------------------------------------------------
const          1.3423      0.313      4.292      0.000       0.722       1.963
x1            -0.0402      0.145     -0.278      0.781      -0.327       0.247
x2            10.0103      0.014    715.745      0.000       9.982      10.038
==============================================================================
Omnibus:                        2.042   Durbin-Watson:                   2.274
Prob(Omnibus):                  0.360   Jarque-Bera (JB):                1.875
Skew:                           0.234   Prob(JB):                        0.392
Kurtosis:                       2.519   Cond. No.                         144.
==============================================================================

Notes:
[1] Standard Errors assume that the covariance matrix of the errors is correctly specified.
Ejemplos covid simulation
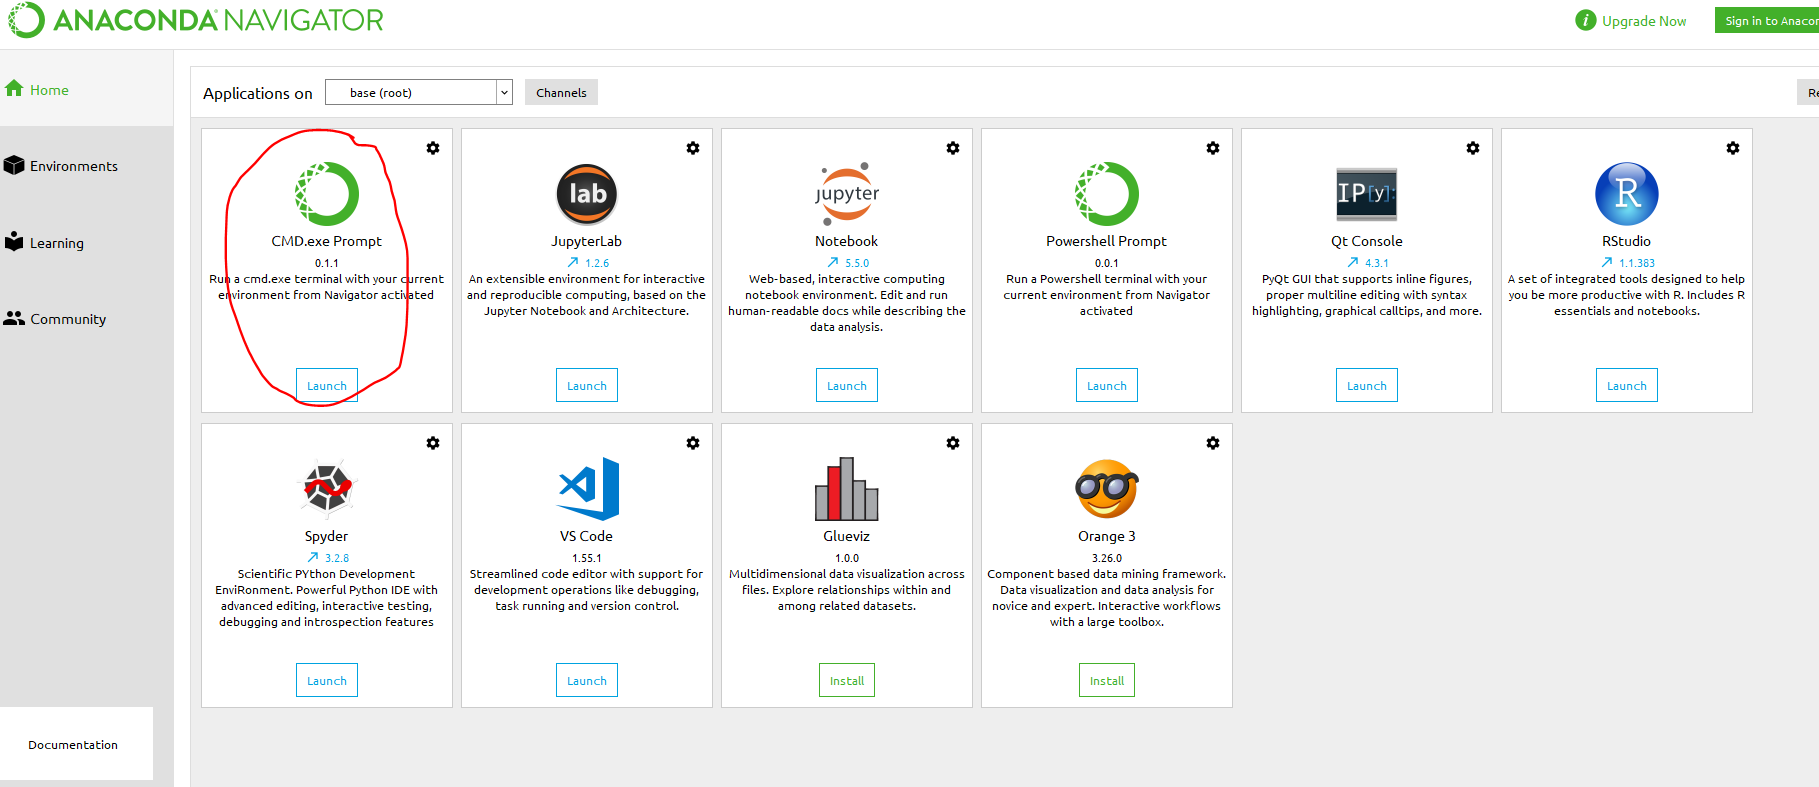
Anaconda
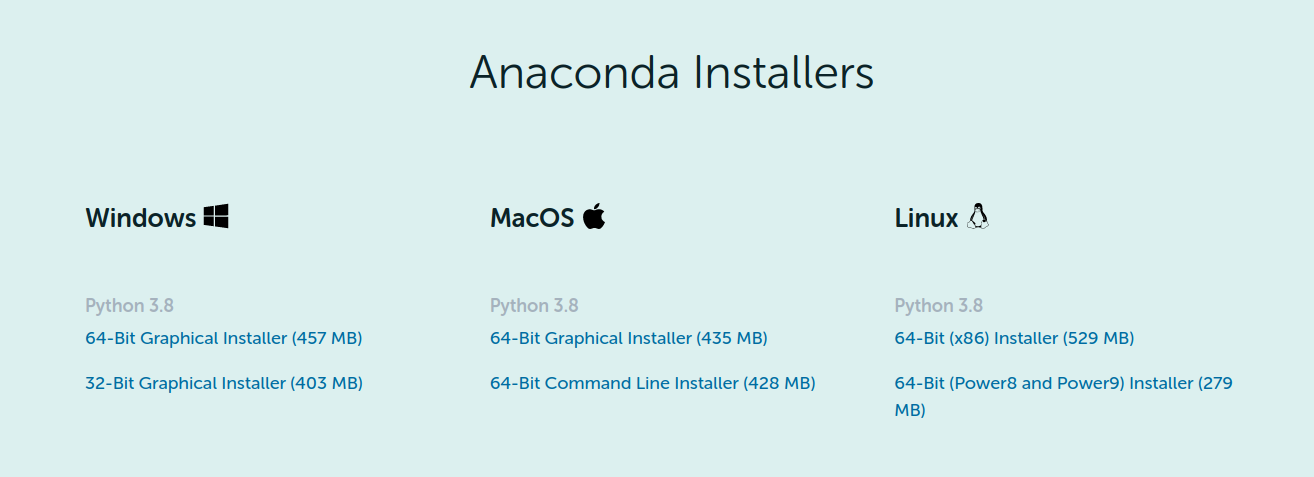
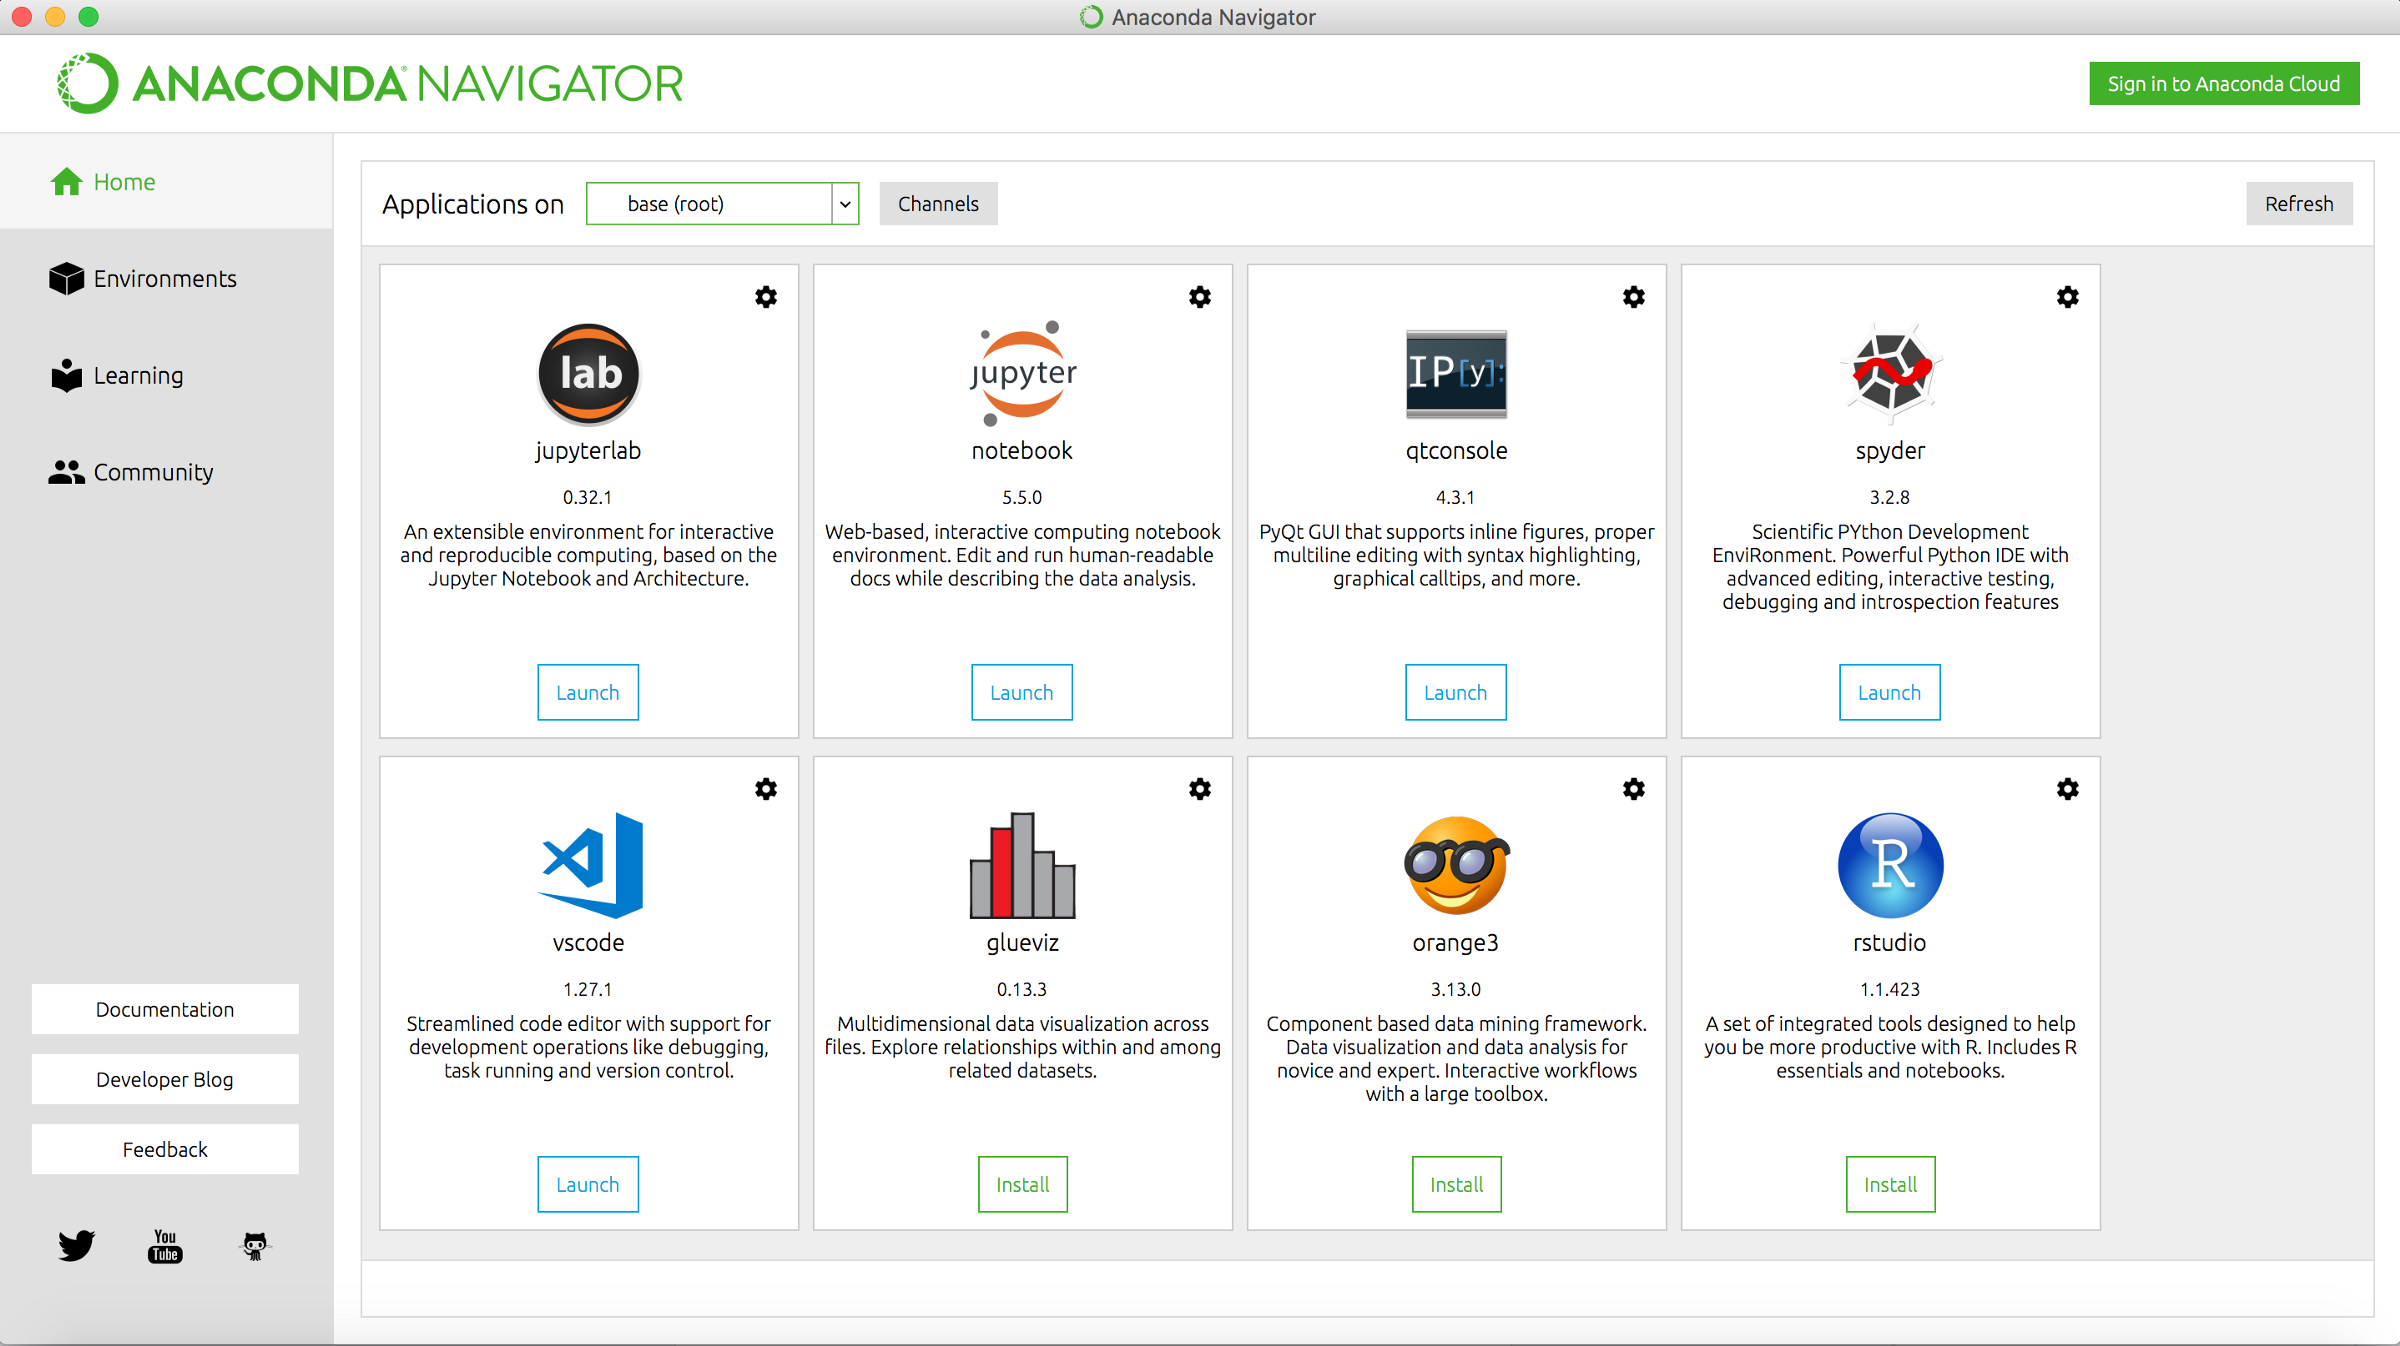
Anaconda es “una distribución libre y abierta de los lenguajes Python y R”.
Tiene soporte para Windows, Mac o Linux.
Ejemplo de cómo instalar https://www.youtube.com/watch?v=52h3r_lROGY&t=541s
Para Mac
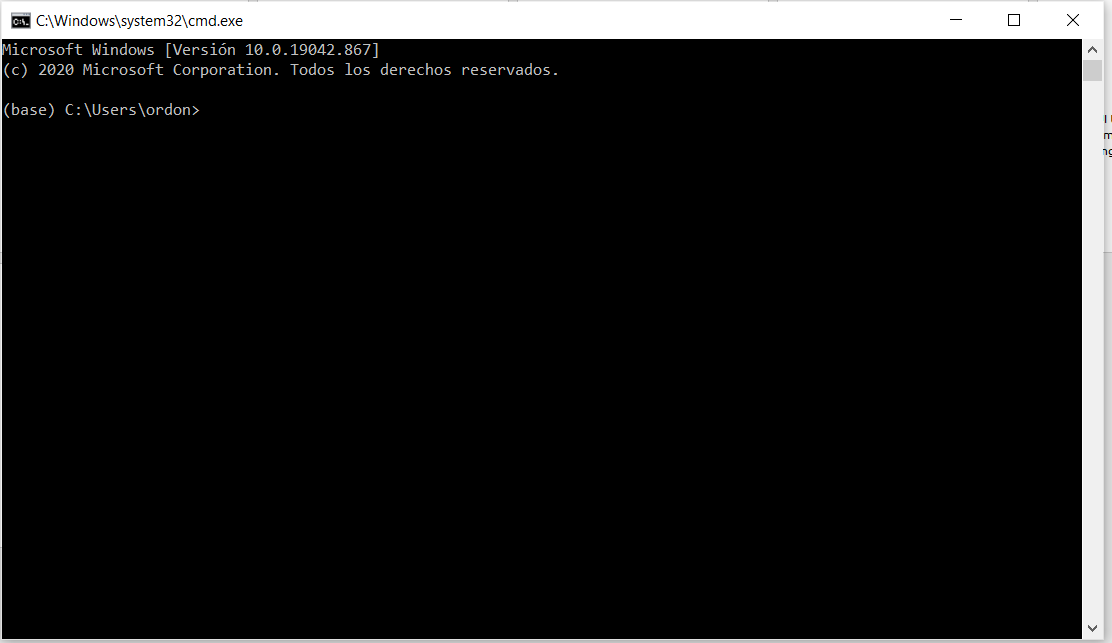
Una vez instaldo Anaconda, abrir una terminal.
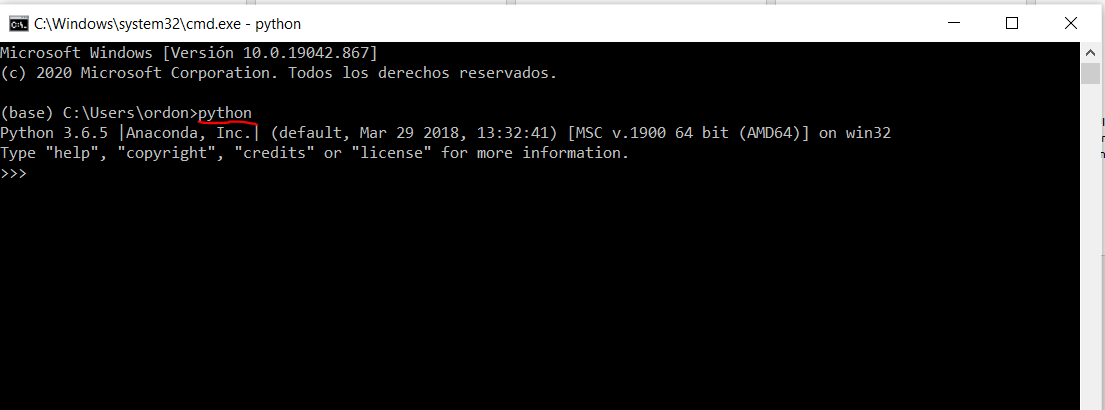
En la terminal, escribir python.
Si python está correctamente instalado les va a mostrar la versión junto a otra información. Por ejemplo
Tareas
Chequear si Python está instalado.
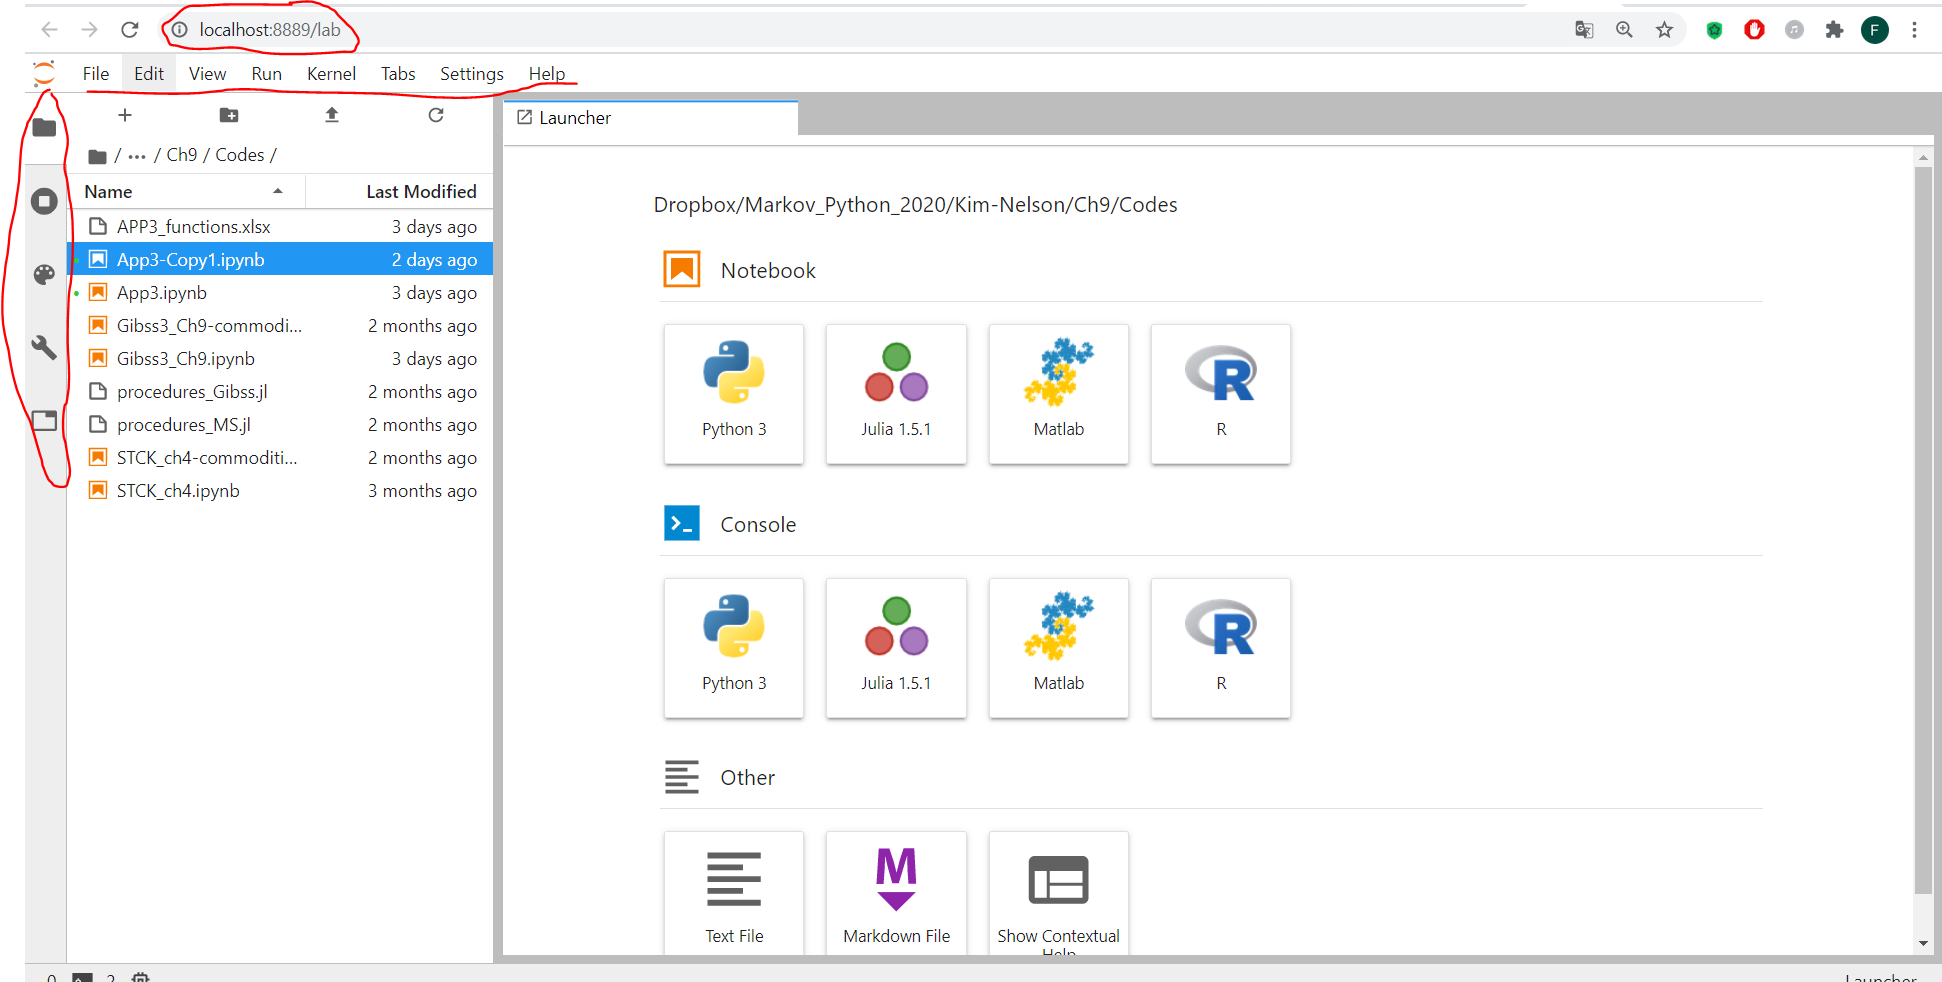
Usar Jupyter para abrir el archivo de intro.ipynb
Instalar
pandasusando conda.Instalar
numpyusando pip.Responder el siguiente formulario: https://forms.gle/hBx1xD5fLBK5NF8QA

